

Discover more from Librarian Capital's Research Library
Highlights
Ex. First Republic, ROTCE was an above-target 21% in Q2 2023
Deposits were better than expected, FY23 NII outlook was raised
However, NII has likely peaked and credit losses are rising
At $149.77, shares are at 1.9x P/TBV and 11x normalized P/E
We see a total return of 49% (18.1% p.a.) by 2025 year-end. Buy
Introduction
JPMorgan (“JPM”) released its Q2 2023 results on Friday (July 14). Shares finished the day up 0.6%, capping a week when they rose 3.8% and reached a new 52-week high:
JPM Share Price (Last 1 Year)
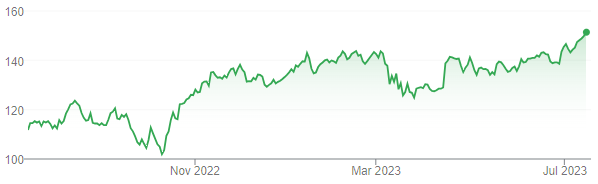
Source: Google Finance (17-Jul-23).
We have followed JPM for over a decade, and our current Buy rating dated back to an upgrade in April 2022. (For a recap of our JPM investment case, see our Substack article in April 2023.) Since that upgrade, JPM shares have gained 21.9% in 15 months (including dividends).
JPM’s Q2 2023 results support our investment case, but earnings are likely to fall hereafter. Excluding a one-off gain from the First Republic (“FRC”) acquisition, Return on Tangible Common Equity (“ROTCE”) was 21%, above management’s 17% target and higher year-on-year, but 2 ppt lower sequentially. Deposit pricing was better than expected and Net Yield rose slightly from Q1, so the full-year Net Interest Income (“NII”) outlook has been raised by about 4%. Investment Banking revenues were weak as expected, and credit costs continued to normalize up. The U.S. economy is still resilient, though a downturn will come eventually and its magnitude is hard to predict. The main headwind to JPM earnings is regulatory, with the Fed set to raise capital requirements significantly. With shares at $149.77, JPM has a 1.9x Price / Tangible Book Value (“P/TBV”), an 11.0x normalized P/E and a 2.8% Dividend Yield. Our updated forecasts show a total return of 49% (18.1% annualized) by the end of 2025, and we reiterate our Buy rating.
JPM’s results are also positive for Bank of America, scheduled to release its Q2 results on Tuesday (July 18).
JPMorgan Q2 Results Headlines
JPM reported a 25% ROTCE in Q2 2023, though results were flattered by the completion of the FRC acquisition on May 1, which added two months of earnings contribution as well as a $2.7bn one-off gain to Q2 results:
JPM Results Headlines (Managed Basis) (Q2 2023 vs. Prior Year)
Source: JPM results supplement (Q2 2023).
Excluding FRC, JPM’s ROTCE was 21% in Q2, higher than both management’s across-the-cycle target of 17% and the prior-year quarter (also 17%), but 2 ppt lower than the 23% achieved in Q1 2023:
JPM Results Headlines ex. FRC (Q2 2023 vs. Prior Periods)
Source: JPM results presentation (Q2 2023).
Excluding FRC, EPS was $3.95 in Q2, still up 43% year-on-year, largely driven by a $5.8bn increase in NII (primarily from higher rates) that more than offset higher Expense and higher Credit Costs. Non-Interest Revenues were (“NIR”) also 6% ($1.0bn) higher year-on-year, with lower Markets revenues ($0.8bn) offset by prior-year investment losses.
We believe JPM earnings are likely at their peak, having grown sequentially every quarter since Q2 2022, and both NII and credit losses are set to become headwinds in the coming quarters:
JPM Earnings, Provisions & Pre-Tax Profit by Quarter (Since Q2 2020)
NB. Figures on managed basis. Source: JPM results supplements.
Q2 2023 results in our view represent an above-cycle quarter where JPM is over-earning, but nonetheless provide important datapoints about the strength of JPM’s business model and long-term earnings sustainability.
Deposit Pricing Better Than Expected
JPM reported a Net Yield (excluding Markets) of 3.83% in Q2 2023, 3 bps better sequentially, thanks to the average rate on interest-earning assets rising slightly more (33 bps vs. 28 bps) than that on interest-bearing liabilities:
JPM Interest Revenue, Loans & Rates (Q2 2023 vs. Prior Periods)
Source: JPM results supplement (Q2 2023).
Average deposits grew 2.9% ($67.9bn) sequentially in Q2, with both interest-bearing and non-interest-bearing deposits rising, though these benefited from a $47.2bn contribution from the FRC acquisition. However, even excluding FRC, average deposits were up by about 1% sequentially, being roughly flat (down 0.3%) in Consumer & Community Banking (“CCB”) and growing 2% in Commercial Banking, though falling by 6% in Asset & Wealth Management.
Just as importantly, these stable deposit balances were achieved with better-than-expected deposit pricing, as CFO Jeremy Barnum explained on the call:
“When you look at Consumer, the combination of the passage of time and the positive feedback we're getting from the field and the CD (Certificate of Deposit) offerings in particular has meant that it's quite a stable environment from that perspective. And similarly in wholesale, we're just seeing slower internal migrations.”
As a result of this better pricing as well as higher rates, JPM raised its full-year NII outlook by about 4%, from around $84bn (announced at the investor day on May 22, including FRC) to around $87bn.
However, the NII benefit will be temporary, as deposit pricing continues to catch up with loan pricing after a time lag. There were signs of this in Q2, for example, with the average rate on deposits rose more than the average rate on loans (28 bps vs. 22 bps) for the first time since rate hikes begun in 2022. Total deposits are also expected to show a “modest downward trend” in future quarters as central banks’ Quantitative Tightening continues.
Management continues to guide to the same medium-term NII run-rate in the mid-70s dollar billions, though CFO Jeremy Barnum acknowledged that “maybe that number should be a little higher” after the FRC acquisition. The gap between the Q2 2023 NII and the guided medium-term run-rate is about $3bn, or nearly 0.3x of Q2 pre-tax profit (excluding FRC).
Investment Banking Weak As Expected
Revenues from investment banking activities in the Corporate & Investment Banking (“CIB”) segment were weak in Q2 2023 as expected, though comparisons with reported numbers were distorted by prior-year one-off items:
JPM CIB Revenues by Type (Q2 2023 vs. Prior Periods)
Source: JPM results presentations.
Investment Banking revenues were reported as higher year-on-year, but were 7% down excluding prior-year bridge book markdowns
Markets revenues fell 10% year-on-year, with declines of 3% in Fixed Income and 20% in Equity respectively
These were offset by Payments revenues being 61% higher-year-on-year, or 32% higher excluding prior-year equity investment markdowns, “predominantly driven by higher rates”.
While JPM probably under-earned in Investment Banking and Markets revenues in Q2 2023, these only added up to about $9bn in the prior-year quarter (and averaged the same across 2022), which means the under-earned amounts there are more than offset by the over-earned amount in NII alone (around $3bn as described above).
Credit costs represent a further area that JPM over-earned in Q2 2023.
Credit Costs Still Below Long-Term Average
JPM’s credit costs continued to normalize up in Q2 2023 but remained below pre-COVID levels.
Reported Provisions for Credit Losses of $2.9bn included $1.2bn for FRC (including reserve build):
JPM Credit Provisions & Charge-Offs (Q2 2023 vs. Prior Periods)
Source: JPM results supplements.
Excluding FRC, Q2 2023 credit costs were $1.7bn, lower than in Q1, and consisting of $1.4bn of Net Charge-Offs (“NCOs”) and $0.3bn of net reserve build. NCOs were 0.47% of retained loans, 4 bps higher sequentially and continuing the upward trend in previous quarters, but still well below pre-COVID levels. (Group NCO were 0.60% in Q2 2019.) The main reason for this is that NCOs in Consumer Cards were still much lower than in 2019.
CEO Jamie Dimon was explicit that JPM has been over-earning on credit costs:
“We're over-earning in credit. We've been over-earning in credit for a substantial amount of time now … We would consider credit card (NCO) normalized to be closer to 3.5%.”
A hypothetical 15 bps increase in group NCO (to 0.62%) on the current $1.3 trillion total loans would cost roughly $2bn a year, or about $0.5bn per quarter, worth 0.05x of Q2 pre-tax profit (excluding FRC).
U.S. Consumer is Resilient … for Now
The U.S. economy is still resilient, as shown in both JPM’s Q2 results and in management comments.
CCB Card Services sales volume were up 8.4% year-on-year, as consumers spent more. Consumer Card outstanding loan balances were up 18% year-on-year, due to both higher balances per account and new accounts.
CFO Jeremy Barnum observed on the call that:
“Both U.S. Consumers and Small Businesses remained resilient and we haven't observed any meaningful changes to the trends in our data we discussed at Investor Day”.
CCB Co-CEO Jennifer Piepszak had stated at an investor conference on June 13 that:
“The median cash buffer (for CCB consumer customers) is still about 20% above pre-pandemic levels and it's even higher at lower income segments, so the consumer remains very resilient.”
However, a downturn will come eventually and its magnitude is hard to predict. As CEO Jamie Dimon said on the call:
“The consumer is in good shape, they are spending down their excess cash. That's all tailwinds. If we go into recession, we're going with rather good condition, low borrowings and good house price-value …But the headwinds are substantial and somewhat unprecedented … We don't know those things will put us in a soft landing, a mild recession or a hard recession.”
Risk of Higher Regulatory Capital Requirements
The main headwind to JPM earnings is regulatory, with the Fed set to raise capital requirements significantly.
Management indicated on the call that they expect “a straight-up across-the-board tax on everything” and “it's kind of hard to optimize your way out of that”. They also quoted comments by Fed chair Jay Powell that indicate a potential 20% increase in regulatory capital requirements.
In theory a higher capital requirement would translate linearly into a lower ROTCE. However, management pushed back on this, suggesting that JPM should be able to reprice its products and services to offset higher capital requirements.
We are cautious on this, because such a repricing requires the whole industry to do the same, and JPM faces non-bank competitors such as private credit funds and private equity firms.
We are monitoring the situation. For the moment we believe JPM (as well as Bank of America) shares are cheap enough to be attractive even with a moderately lower ROTCE, especially as we believe banks are now much safer businesses than in the past and deserve much higher valuation multiples than the present.
JPMorgan Valuation: 11x Normalized P/E
With the share price at $149.77, JPM shares are at 1.9x TBV. (TBV/Share is $79.90).
Assuming a 17% ROTCE for normalized earnings, the P/E multiple is 11.0x. Relative to historical earnings, JPM shares are on 12.6x 2019 EPS and 12.1x 2022 EPS (adjusted for subsequent buybacks).
The current Dividend Yield is 2.8%, after JPM has raised its dividend by 5% to $1.05 per quarter ($4.20 annualized) after the Fed’s stress test results in July.
JPM Illustrative Stock Forecasts
For our illustrative forecasts, we raised our 2023 ROTCE to 20% but keep other assumptions unchanged. These include:
Tangible Book Value to rise to $240bn at 2023 year-end then stay flat
ROTCE to be 20% in 2023, 12% in 2024 and 17% in 2025 (was 16% in 2023)
Dividends to be $4.20 in both 2023 and 2024 (was $4.15 and $3.29)
Dividends to be based on a 33% Payout Ratio after 2024
2023 year-end share count to be 1.5% lower year-on-year
Net Income after dividends to be spent on buybacks
Buybacks to be done at 2.0x P/TBV
P/E multiple to be 14.5x at 2025 year-end
As before, the lower ROTCE in 2024 reflects a mild U.S. recession. For now we have not modelled the impact of higher regulatory capital requirements, which may force buybacks to be paused temporarily.
Our new 2025 EPS forecast of $14.62 is about 1% lower than before ($14.71):
Illustrative JPM Return Forecasts
Source: Librarian Capital estimates.
With shares at $149.77, we expect an exit price of $212 (implying a P/TBV of 2.3x and a Dividend Yield of 2.3% at exit) and a total return of 49% (18.1% annualized) by 2025 year-end. JPM shares had previously peaked at around $172 in October 2021, or nearly 2.5x its Q3 2021 TBV/Share ($69.87).
Reducing our exit P/E assumption to 12.0x, i.e. assuming no re-rating, would instead lead to a forecasted total return of 25% (9.7% annualized). This is roughly equal to JPM’s earnings yield of around 8% (as implied by the 2022 EPS) being returned to shareholders in dividends and buybacks, plus some timing effects and compounding.
We reiterate our Buy rating on JPMorgan stock. Buy.
Stocks mentioned: JPM 0.00%↑ BAC 0.00%↑. We are long both.
Disclaimer: This article consists of personal opinions, based on information believed to be correct at the time of writing, but not guaranteed. We undertake no responsibility in updating content in this article. Nothing published here should be taken as financial advice.