

Discover more from Librarian Capital's Research Library
Highlights
EL had its fourth quarter of year-on-year sales decline
Management blamed weak China and Korea Travel Retail
We see effects of past poor execution now turning visible
Weakness will linger, but strong brands should carry EL through
We see 41% upside (11.7% p.a.) by June 2026. Buy
Introduction
We review Estée Lauder (EL) after shares crashed 17% on Wednesday (May 3) following Q3 FY23 results. EL’s share price is now down 21% in the past year, and 45% lower than its peak in December 2021:
EL Share Price (Last 1 Year)
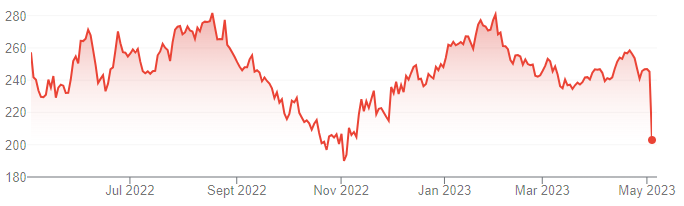
Source: Google Finance (03-May-23).
EL sales fell 8% organically year-on-year in Q3 FY23. This was the fourth consecutive quarter of year-on-year decline, and EL sales had fallen back to pre-COVID levels since Q4 FY22. Inventory levels were too high in CY22, and de-stocking has continued to be a headwind. FY23 guidance was cut to an organic sales decline of 5-7% and an Adjusted EPS decline of 54%. EL’s poor performance was in sharp contrast to the continuing growth at L’Oréal. While much of the difference was attributed to EL’s higher exposure to China and Travel Retail, EL has made key mistakes and their effects are now becoming clear. At the very least management has failed to adapt to recent events, At $202.70, EL shares are at 27.7x FY22 Adjusted EPS, but this potentially included the benefit of excess retailer inventory. We maintain our Buy rating, in the belief that EL’s strong brands and products and will ultimately matter more than the quality of its management, and our reduced forecasts indicate a total return of 41% (11.7% annualized) by June 2026.
As this is our first EL article on Substack, we start with a longer recap of its investment case. Readers familiar with our research can jump one section ahead to “Estée Lauder Q3 FY23 Results”.
Estée Lauder Investment Case
We have followed Beauty stocks for close to a decade, and started publishing our research on Estée Lauder online with a Buy rating in April 2020. We have maintained our Buy rating since then, and EL shares have still gained 28% after 3 years at the current price, but EL has been removed from our portfolio and “top buy” list as of January this year.
Our investment case on EL has included the following components:
Structural growth in the Beauty market, driven by growing demand from APAC (especially China) and premiumization
EL sales growing faster than market, thanks to its brands, products, scale, innovation and marketing capabilities
EL earnings growing faster than sales, thanks to natural operational leverage on its platform
Compared to its main rival L'Oréal, we had expected EL to continue growing faster because of its focus on the faster-growing Prestige segment and Skin Care category.
Before COVID-19, EL’s medium targets included ex-currency Net Sales growth of 6-8% and EBIT Margin expansion of approx. 50 bps annually, which (assuming an EBIT margin of around 20%) imply an annual EBIT growth of around 11%:
EL FY20-22 Outlook (Before COVID-19)
Source: EL presentation at Bernstein conference (May-19).
EL’s growth in FY18 and FY19 were higher than these targets, with growth exceeding 10% and EBIT growth exceeding 15% (both excluding currency). FY20 saw declines, but the FY21 rebound more than offset these:
EL Net Sales & EBIT Growth Y/Y (ex. FX) (FY15-22)
NB. FY ends 30 Jun. Source: EL company filings.
Asia/Pacific was key behind the acceleration in growth since FY18. Outside Korea, Asia/Pacific Travel Retail is reported as part of EMEA and helped accelerate the region’s ex-currency sales growth to double-digits from FY16. Asia/Pacific’s own sales growth accelerated to double-digits (ex-currency) from FY18.
However, EL’s growth has turned negative since Q4 FY22 (April-June of 2022), including in the latest quarter.
Estée Lauder Q3 FY23 Results
EL sales fell 8% organically year-on-year in Q3 FY23, driven by a 24% decline in EMEA (primarily due to Travel Retail locations outside Korea that are included in the segment):
EL Net Sales by Region (Q3 FY23 vs. Prior Year)
Source: EL results release (Q3 FY23).
This was the fourth consecutive quarter of year-on-year sales declines, which started with Q4 FY22 (Q2 CY22):
EL Ex-Currency Sales Growth Y/Y (Since CY20)
Source: EL company filings.
Compounding the ex-currency growth rates gives a total 3-year growth rate (from 2019) of 13% in Q1 CY22, but this fell to -1% in Q2 CY22 and was only mid-single-digits in Q3 and Q4. The 4-year growth rate was 3% for Q1 CY23 (Q3 FY23).
As reported in dollars, EL sales had fallen back to pre-COVID levels since Q4 FY22, despite inorganic growth such as the $1.1bn acquisition of Dr. Jart+ in December 2019:
EL Sales by Quarter (Since CY19)
Source: EL company filings.
Management blamed Travel Retail in both China and Korea for EL’s sales decline.
Management Blamed Travel Retail
CEO Fabrizio Freda attributed EL’s bad Q3 FY23 entirely to weak Travel Retail on the earnings call:
“Nearly all developed and emerging markets grew organically … to offset an even lower-than-expected recovery in our Asia travel retail business … Asia travel retail faced two headwinds in the third quarter. The first, elevated inventory in Hainan … (and) conversion of travellers to consumers in prestige beauty lagged historical trends … This led to even lower replenishment orders than we anticipated. The second headwind’s the transition in Korea to post-pandemic regulations, as traveling consumers gradually returned pressured sales meaningfully.”
He further stated that Travel Retail showed an organic sales decline of 45%, while the rest of EL grew 10%.
The issue of elevated inventory among travel retailers in Hainan is important, one because it means that EL’s FY22 earnings were potentially larger than they should be, and two because this is expected to create a continuing headwind for EL sales. CFO Tracey Travis explained the latter on the call:
“On the fourth quarter, we are expecting that our retail sales in Travel Retail will be up double-digits, and our net (reported) sales are down double-digits … this is another quarter of trying to … whittle down the inventory that's in the trade … Some of this will bleed into the first quarter (of FY24), and perhaps a little bit into the second quarter”.
Inventories on EL’s own balance sheet has also rose by 50% during CY22, from $2.08bn to $3.10bn.
As a result of elevated inventories and a slower recovery in Asia Travel Retail, EL cut FY23 guidance substantially.
Full-Year FY23 Guidance Cut
EL’s 8% organic sales decline in Q3 FY23 (plus another point of decline from disposals) led to a 74% collapse in Non-GAAP EPS, as expenses stayed roughly flat and Non-GAAP EBIT margin collapsed from 21.6% to 8.4%:
EL Non-GAAP P&L (Q3 FY23 vs. Prior Year)
Source: EL results release (Q3 FY23).
Year-to-date, sales fell 13% year-on-year (9% excluding currency) and Non-GAAP EPS has halved to $3.38.
FY23 guidance was cut to reflect a continuing slow recovery in Asia Travel Retail, and now includes:
Organic sales decline of -7% to -5% (was -2% to flat)
Non-GAAP EPS of $3.29-3.39 (was $4.87-5.02), more than halving from FY22 ($7.24)
The guidance implies Q4 FY23 organic sales growth of between -3% and +7%.
Management is still budgeting for FY24, but CFO Tracey Travis indicated on the call that Adjusted EBIT margin will have “more than 50 bps” of expansion from its FY23 low “but certainly not to the 19% level (back in FY21)”.
EL Soundly Beaten by L’Oréal
EL’s poor performance was in sharp contrast to the continuing growth at L’Oréal.
At L’Oréal, year-on-year like-for-like sales growth has been positive every quarter since Q3 CY20:
L’Oréal Like-for-Like Sales Growth Y/Y (Since CY20)
Source: L’Oréal company filings.
Compounding the like-for-like growth rates give a total 3-year growth rate (from 2019) of 19% in Q1 2022, accelerating to 26% by Q4 2022. The 4-year like-for-like growth was 34% at Q1 CY23 (compared to 3% at EL).
Measured in euros, L’Oréal sales are also materially higher than pre-COVID levels, accelerating from being 20% higher than 2019 levels in Q1 2022 to being 31% higher in Q4 2022; Q1 2023 was 37% higher:
L’Oréal Sales by Quarter (Since CY19)
Source: L’Oréal company filings.
When asked about the contrast between EL and L’Oréal, CEO Fabrizio blamed EL’s larger Travel Retail exposure:
“Our different situation versus peers, I would say that if you look at business overall, the answer of the difference is in the level of stocks in the TR (Travel Retail) and the volatility, and the fact that we are bigger, and historically more exposed, to the strong accretive channel that in a moment of crisis obviously resulted into a big negative.”
We do not believe this is the full story.
Travel Retail Doesn’t Explain Everything
EL is more exposed to China and to Travel Retail than L’Oréal, based on the limited disclosure available:
At EL, China (including Travel Retail locations) represented 34% of sales in FY22; Korea was another 11%
At L’Oréal, the Chinese Yuan represented 19% of sales in CY22; Travel Retail was 9% of sales in 2019
At the extreme, these figures may indicate that EL has exposure to China of a 40%+ and L’Oréal has one of 20%+.
However, as explained above, since Q2 CY22 L’Oréal’s total sales have grown to 25-35% above 2019 levels each quarter, while EL sales have grown to around 5% above (both percentages exclude currency). Even if we think there is a 20% gap in exposure to China between the two companies, the 20-30% difference in growth is too extreme.
And Chinese consumers unable to buy from Hainan and Korea Travel Retail are not lost entirely, as EL management’s own comments on the call reveal:
“There were bright spots for travel retail in Hong Kong, Macau, Europe, and the Americas.” (CEO)
“Hong Kong (sales) doubled in size partially due to the return of Chinese travellers … Mainland China grew low single-digits organically” (CFO)
Instead we believe EL has made key mistakes and their effects are now becoming clear.
Past EL Management Mistakes
Management has made key mistakes in managing their business and operations.
Distribution in China had been served by a national distribution centre in Shanghai. When Shanghai underwent a two-month COVID lockdown in April-May 2022, EL sales in China fell 13% (vs. the market falling 10%) in Q4 FY22. (Management claimed they have now regained that lost market share.)
The elevated inventory described above was attributed by EL to an overestimate of the speed of Travel Retail recovery.
EL has also belatedly acknowledged that their supply chain was too long, as CEO Fabrizio Freda explained:
“This (inventory) situation is also impacted by our relatively long supply chain … (which) has an impact on the fact that the retailers, when they decided their stock for us, which is not true for every one of our peers, they need to make a bet several months before when they receive the products.”
We also suspect that EL’s e-commerce capabilities in China (or perhaps globally) are under-developed compared to L’Oréal. This explains why L’Oréal was much less affected by lockdowns and weak Travel Retail, because it was able to reach the same Chinese customers and fulfil their orders online instead.
We already raised the issue of poor execution back in November. EL was experiencing problems even before COVID (for example with U.S. department stores), and the risk of bad management is much higher at family-controlled firms like EL At the very least the team has failed to adapt to recent events.
Why We Have Stuck with EL
Our Buy rating on EL has been a mistake for the past year.
However, we have continued to stick with EL because we believe its strong brands and products and will ultimately matter than the quality of its management.
After Q3 FY23 proved another disappointment, we have lowered our expectations and cut our forecasts accordingly.
Estée Lauder Valuation
At $202.70, relative to FY22 Non-GAAP financials, EL shares have a 27.7x P/E and a 3.0% FCF Yield:
EL Earnings, Cashflows & Valuation (FY19-CY22)
Source: EL company filings.
However, these statistics may be unfairly flattering for several reasons. We have adjusted out the working capital outflow in FY22, earnings have collapsed since then, EL’s Non-GAAP EPS excludes relatively frequent restructuring charges ($0.31 in F22), and retailer inventory levels were elevated in FY22.
Relative to FY23 guided Non-GAAP EPS, EL shares have a P/E of around 61x.
The Dividend Yield is 1.3%, with a dividend of $0.66 per quarter ($2.64 annualized).
EL paid out $687m of dividends and repurchased $258m of its shares in Q1-3 FY23. These were not fully covered by cash generation, which was only $365m after $1.02bn of Operating Cashflows and $652m of CapEx.
Estée Lauder Stock Forecasts
We have cut our forecasts substantially. We have reduced FY24 Net Income by 20% but still assume FY25 Net Income will be around 10% above FY22. We reflect our lower level of confidence with a lower exit P/E assumption.
Our key assumptions now include:
FY23 EPS of $3.34 (was $4.95)
FY24 Net Income at 80% of FY22 level (was 100%)
FY25 Net Income at 110% of FY22 level (was 111%)
Share count to fall by 1.0% annually
From FY24, dividend to rise by 8% annually
P/E to be at 30x at FY26 year-end (was 35x)
Our new FY26 EPS estimate of $9.20 is 1% lower than before ($9.29), and our FY26 exit price of $276 is 15% lower than before ($325):
Illustrative EL Return Forecasts
Source: Librarian Capital estimates.
With shares at $202.70, we expect a total return of 41% (11.7% annualized) by June 2026.
We reiterate our Buy rating on Estée Lauder stock.
Ends
Stocks mentioned: EL 0.00%↑.